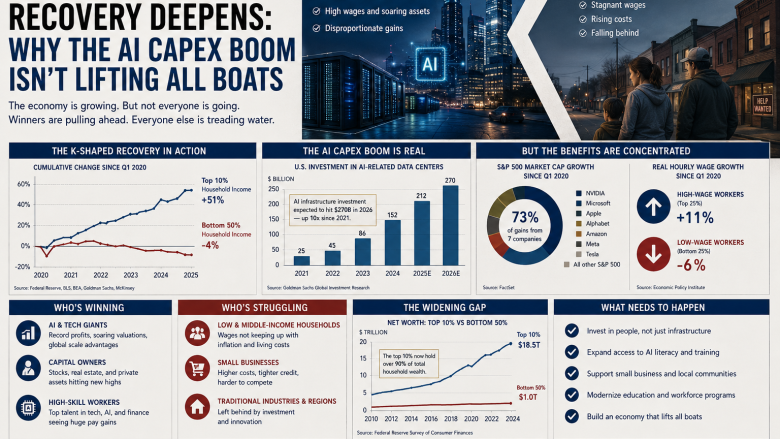
The numbers describing America’s AI investment boom are genuinely staggering. The five largest US hyperscalers — Microsoft, Alphabet, Meta, Oracle, and Amazon — collectively plan to spend $720 billion on capital expenditures in 2026, according to Q1 earnings guidance. That is a 69% increase from 2025 and a 207% increase from 2024. Roughly 75% of that spending is earmarked for AI infrastructure: GPUs, high-bandwidth servers, purpose-built data centers, and the power infrastructure to run them.
Wall Street has absorbed this information and responded bullishly. AI-related companies reported strong earnings in the most recent reporting season, and the equity market has, for the most part, rewarded the ambition. BlackRock, JPMorgan, and Morgan Stanley all maintain AI as the central thesis for their US equity outlook.
But beneath those headline numbers, a more complicated picture is developing — one that JPMorgan, BlackRock, and J.P. Morgan Asset Management have each documented in their 2026 research. The AI CapEx boom is distributing its benefits with extraordinary unevenness. Strong capital expenditure is contracting alongside weaker labor demand and weaker consumer spending at the bottom of the income distribution. The economy is creating winners and non-participants simultaneously, and the gap between them is widening. Economists call this a K-shaped recovery. The data increasingly confirms it.
The Scale of AI Infrastructure Investment
Hyperscaler capex has entered what analysts are calling unprecedented territory. Per Q1 2026 earnings, Microsoft is tracking toward $120 billion or more in fiscal 2026. Alphabet is guiding to $180–$190 billion. Amazon has targeted $200 billion. Meta plans $115–$135 billion, including a 1-gigawatt data center in Ohio. The aggregate across the five major hyperscalers sits above $720 billion for the year.
To contextualize the scale: hyperscalers are now spending 45%–57% of revenue on capital expenditures — ratios that historically characterize industrial or utility companies, not technology firms. This capital intensity exceeds internal cash generation, forcing hyperscalers to debt markets. Morgan Stanley and JPMorgan projections suggest the technology sector may need to issue $1.5 trillion in new debt over the next several years to finance AI infrastructure construction.
Wall Street analysts at Evercore and Bank of America estimate total AI capital expenditures could top $1 trillion in 2027, following even bigger spending plans unveiled during April 2026 earnings calls.
The Labor Market Divergence
BlackRock’s April 2026 Market Outlook presented the most direct accounting of the divergence. Agentic compute grew from nearly zero to a majority of all compute by the second half of 2025. The company noted that the moment AI agents could instruct other AI agents arrived in Q1 2026 — a threshold some analysts described as the “zenith of computation.” The consequence for labor is observable in the data: rolling 11-month job growth excluding healthcare has turned negative, at -266,000, per BlackRock’s analysis. Labor costs as a share of business output continue their multi-decade decline.
Layoffs surged more than 50% in 2025 compared with the prior year, according to Challenger, Gray & Christmas. Amazon, Home Depot, and UPS announced cuts early in 2026. Company surveys predict 2026 will be the worst year for college graduate employment on record.
JPMorgan’s US economic outlook is direct: “In the economy, strong CapEx stands in contrast to weaker labor demand and consumer spending. Across households, the divide between high and low income is widening, creating a classic K-shaped recovery.”
The Consumer Split
BlackRock quantified the consumer divide with unusual precision in its April 2026 research. The top 30% of US consumers by income account for roughly 50% of all spending; the top 10% account for 23%. Wealth has become dramatically more concentrated in both higher-income cohorts and older generations — and these cohorts are driving a robust top-line GDP growth number that masks genuine stress for everyone else.
J.P. Morgan Asset Management adds that tariff-driven price increases and lower immigration are slowing growth at the aggregate level, while the S&P 500’s continued gains generate substantial wealth effects that are highly concentrated among top income quintiles. That dynamic supports spending on high-end services and goods even as low-end spending remains sluggish.
CNBC reported that Trump administration affordability efforts have had limited impact on this dynamic, according to JPMorgan’s head of global markets strategy Dubravko Lakos-Bujas. The White House has pushed for temporary caps on credit card interest rates and a ban on institutional investors buying homes — interventions that have not measurably altered the spending split.
AI’s Cross-Sector Expansion
JPMorgan describes AI as “no longer just a tech story” — it is spreading into banks, healthcare, logistics, and utilities. Morgan Stanley’s analysis of the $740 billion AI capex figure confirms that banks stand to benefit from rising financing demand, resilient M&A activity, and long-term efficiency gains. The bank projected AI could boost bank productivity by 20%–50% over the next five to ten years.
Four sectors capture the second-order flows from hyperscaler spending: semiconductors (the largest single beneficiary), power and utilities (AI clusters require massive electricity), data center REITs, and cooling and networking equipment manufacturers. These second-order beneficiaries have attracted significant investor interest as an alternative to holding concentrated positions in the Magnificent Seven names directly.
The Paradox for Markets
The K-shaped economy presents a paradox for market participants. The macro environment is generating exceptional equity returns for investors positioned in AI-exposed sectors while simultaneously creating conditions that are economically stressful for a large share of the working population. These two things can coexist in the medium term, but they create structural tension with political and eventually economic consequences.
The political dimension is already visible. The 2026 midterm elections are occurring against a backdrop in which the economy — measured by GDP and corporate earnings — looks strong, while the economy as experienced by median-wage workers looks weak. This divergence complicates the political economy of both fiscal and monetary policy.
The deeper economic tension lies in the consumption channel. If the top 30% of consumers by income are driving 50% of spending, the economy is highly dependent on sustained asset appreciation — in equity markets and housing — to maintain that consumption level. A meaningful correction in either would expose the underlying weakness in consumer spending that headline numbers are currently masking.
For investors, the K-shaped structure has practical portfolio implications. Positioning in AI capex second-order beneficiaries — power utilities, cooling infrastructure, data center REITs, chip manufacturers — provides exposure to the structural spending trend while diversifying away from the concentration risk in the five major hyperscalers. But those positions carry their own risks. REIT sensitivity to long-duration Treasury yields is significant, and the credit market is beginning to reprice the capex-intensity of some large AI infrastructure commitments. Oracle’s five-year CDS spread widened from roughly 40 basis points at the start of 2025 to approximately 200 basis points by March 2026, with S&P and Moody’s both moving to a negative outlook — a reminder that debt markets can reprice capital intensity quickly.
What Investors Should Watch
Four indicators will determine whether the K-shaped divergence deepens or begins to close in the second half of 2026.
Non-farm payrolls excluding healthcare is the most direct real-time indicator of AI’s displacement effect on the broader labor market. Continued deterioration here — building on the -266,000 rolling 11-month figure — would validate the K-shaped thesis and create political pressure for policy responses that could reshape the investment environment.
Consumer credit quality at the bottom of the income distribution is the earliest warning signal for consumption stress below the median. Delinquency rates on credit cards and auto loans among lower-income borrowers bear watching closely. If the top-income consumption story starts to crack simultaneously, the K-shape ceases to be a distribution problem and becomes a macro problem.
Hyperscaler revenue versus capex ratios are the key test of whether the AI buildout is generating returns. Capex-to-revenue ratios of 34%–75% — currently being seen at Microsoft and Alphabet — are utility-level, and historically unsustainable for technology companies without commensurate revenue acceleration. The Q2 2026 earnings season will be the first meaningful test of whether AI revenue is tracking AI spending.
Finally, credit markets will provide the earliest warning. As Penn Capital noted, in capex-heavy regimes, credit spreads tend to reprice risk before equity markets do. Monitoring investment-grade spreads for AI-heavy issuers and watching for further CDS widening in the Oracle-style pattern will provide advance signals of stress in the AI buildout financing.
The Structural Question
America’s K-shaped recovery in 2026 is not a story about economic failure. Corporate earnings are strong, equity markets have performed, and the AI infrastructure investment cycle is genuine. It is a story about distribution: the benefits of the current expansion are flowing with unusual concentration to capital owners, AI-exposed sectors, and upper-income consumers, while labor market weakness, stagnant wage growth for median earners, and AI-driven displacement are creating real stress for a large share of the working population.
For investors, the tactical conclusion is straightforward: the AI CapEx boom is real and investable, but it rewards selectivity. The second-order beneficiaries — power infrastructure, semiconductors, data center REITs — may offer better risk-adjusted exposure than concentrated bets on the hyperscalers themselves.
The structural conclusion is more sobering: an economy this dependent on asset appreciation and upper-income spending for its headline performance is vulnerable to the very rate increases that the Federal Reserve may now be contemplating. If Kevin Warsh’s hawkish regime change materializes — with higher-for-longer rates or even hikes — the K-shape risks becoming more pronounced, not less. The top of the K would face rate pressure on financial assets; the bottom would face continued labor market displacement without the benefit of the wealth effects that have sustained upper-income spending.
That is the tension that neither the equity market’s record highs nor the GDP growth rate are currently pricing.
Sources: J.P. Morgan Global Research, J.P. Morgan Asset Management, BlackRock, CNBC, Morgan Stanley, Futurum, Penn Capital, AL Capital Advisory, HeyGoTrade, Challenger Gray & Christmas, Evercore, Bank of America