With the 2026 US midterm elections now months away, a familiar cycle is beginning: cable networks are filling airtime, political strategists are making predictions, and investors are asking whether they should be adjusting portfolios based on which party controls Congress after November.
The short answer, according to more than 90 years of market data, is probably not. The longer answer — which is more useful for portfolio management — is that midterm election years do have a historically identifiable market pattern, but the forces that create that pattern are not primarily political. They are structural, and they resolve predictably once the uncertainty they generate is removed.
This is particularly relevant in 2026, a year in which the midterm election narrative is competing for investor attention with far more immediate market-moving forces: the Middle East energy shock, new Federal Reserve leadership under Kevin Warsh, a $720 billion AI capital expenditure cycle, and a Bitcoin institutional selloff that has reminded markets of crypto’s macro sensitivity. Understanding what history says — and what it does not say — about midterm markets helps investors separate genuine risk from political noise.
What 90 Years of Data Actually Show
The data on midterm election markets is consistent across multiple research organizations and time periods. US Bank Asset Management Group Research reviewed Bloomberg market data spanning 125 years and 31 midterm elections. Capital Group examined more than 90 years of S&P 500 data. BlackRock analyzed average S&P total returns since 1970 indexed to midterm dates. Their findings align closely.
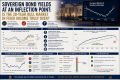
Midterm election years have historically been among the weakest performing years for the US stock market compared with both presidential election years and non-election years. US Bank’s analysis puts the average pre-midterm 12-month return at 2.9% — compared with a historical long-run average of 8.9%. That gap is substantial and replicable across different measurement methodologies.
However, the post-election period dramatically reverses this underperformance. The S&P 500 has gained an average of 15.4% in the year following midterm elections, going back to 1950, according to Standard & Poor’s data. Capital Group and BlackRock’s independent analyses confirm this post-election recovery pattern. The mechanism is straightforward: midterm uncertainty compresses risk appetite; resolution of that uncertainty — regardless of outcome — releases suppressed risk-taking.
The Uncertainty Premium
Northern Trust’s research provides the theoretical framework that explains the pattern. Empirical research shows that political uncertainty and required risk premia tend to run higher around midterm elections than during presidential election years themselves, even though presidential contests attract far more public and media attention. Academic research by Demirer and Gupta found that stock-bond correlations vary with the presidential cycle, reflecting shifting risk preferences. The midterm effect, in their analysis, is not a market anomaly — it is a rational compensation for political uncertainty.
Once that uncertainty resolves — Congress changes hands or does not, tax and spending policy trajectory becomes clearer, divided or unified government is established — the uncertainty premium dissipates. Investors who exited risk assets to avoid midterm uncertainty typically return at higher prices than they left, which is precisely why the post-election recovery pattern persists across widely different political environments.
What 2026 Looks Like So Far
Year-to-date through mid-March 2026, the S&P 500 had declined modestly, with total returns around -2% to -3%, according to EDGE Investment Solutions — consistent with the typical early-year pattern in midterm years. However, research firms are careful to note that the 2026 weakness is being driven more by the Middle East energy shock and Federal Reserve uncertainty than by election-specific factors.
Capital Group’s political economist Matt Miller noted that President Trump used the State of the Union to kick off the 2026 campaign directly, emphasizing a policy agenda designed to help Republicans defy the historical midterm setback. The outcome of that effort — whether Trump and the Republican Party can maintain or expand Congressional control — will influence the 2027 policy environment. But research consistently shows that the specific party outcome matters less for long-term returns than the resolution of uncertainty itself.
The Merrill Lynch CIO Capital Market Outlook published in June 2026 reinforced this point directly: “History suggests that long-term equity returns are driven by earnings, not election outcomes. For investors, the implication is straightforward — tune out the election noise, stay focused on fundamentals, and maintain a long-term perspective.”
What Party Control Actually Changes — and What It Doesn’t
The research from multiple organizations — Capital Group, BlackRock, Northern Trust — consistently finds that the party controlling Congress has historically had minimal impact on long-run equity market returns. Markets have posted positive returns across all election outcome combinations: unified Democratic government, unified Republican government, divided government in both configurations. Performance differs at the sector level — healthcare, energy, defense, and financial services can see meaningful swings depending on specific policy postures — but at the index level, party outcome is not a reliable predictor of returns.
The scenarios that actually move markets are policy-specific rather than party-specific: tax rate changes that affect corporate earnings, deficit changes that affect Treasury supply and yield levels, regulatory changes that affect specific sectors. In 2026, the most market-relevant policy variables — the Federal Reserve’s stance, the trajectory of AI-related deregulation, and the future of the One Big Beautiful Bill Act’s tax provisions — will be shaped by both election outcomes and forces entirely independent of them.
Why 2026 Requires Extra Caution with Historical Templates
The analytical challenge in 2026 is precisely that the midterm election is occurring alongside a more volatile macroeconomic backdrop than most recent midterm cycles. In 2018, 2014, 2010, and 2022, the primary market drivers during the pre-election period were relatively contained interest rate environments and stable growth expectations. In 2026, investors are simultaneously navigating a potential Federal Reserve regime change, a Middle East energy shock, record-level AI capital expenditure, and an institutional Bitcoin selloff.
This context means the standard pre-midterm playbook — expect muted returns, expect volatility, position for post-election recovery — needs to be applied with more caution than historical averages suggest. The post-election recovery pattern holds, on average, because the resolution of political uncertainty releases risk appetite back into a fundamentally sound environment. If the macro environment in November 2026 features rising Treasury yields, a hawkish Fed under Warsh, and persistent energy-driven inflation, the structural tailwind for a post-election recovery will be weaker than the 15.4% historical average implies.
The sector allocation implication is more actionable than the index-level read. Healthcare, defense, and financial services are the sectors most likely to see meaningful share price movement in response to specific election outcomes — because their regulatory and policy environments are most directly affected by which party controls the relevant congressional committees. For investors with concentrated exposure in these sectors, hedging election risk with options or reducing concentration ahead of November is a rational, data-supported approach.
What Investors Should Watch
Four signals will determine whether the historical midterm pattern holds in 2026 or gets overwhelmed by macro forces.
Congressional polling trajectory — tracked through the Cook Political Report and similar non-partisan forecasters — provides the market’s best real-time read on likely election outcomes. Significant movement toward unified Republican control or a Democratic wave would be the most actionable political signal for sector-level positioning in healthcare, defense, and financial services.
Consumer sentiment data in the months before the election influences both turnout patterns and the policy environment that elected officials inherit. A deterioration in consumer confidence driven by energy prices and labor market weakness could shift the political dynamic in ways that affect both election outcome and the post-election policy agenda — a two-step transmission that makes consumer data more relevant than it might initially appear.
The pre-election market volatility pattern itself is worth monitoring. Capital Group’s research identifies a characteristic shape to midterm election years: low returns in early months followed by a rally in the weeks before and after the election. Whether 2026 follows that typical shape — or diverges because of macro headwinds — will tell investors whether historical templates are applicable or whether the current cycle represents a structural departure.
Post-election policy signaling — the weeks immediately after the election, when committee assignments and legislative priorities become clear — is the most important period for sector-specific positioning. Tax policy, defense spending, healthcare regulation, and financial services oversight are the areas where specific policy commitments will drive the most meaningful share price movement.
The Practical Takeaway
The 2026 US midterm elections will generate substantial political coverage and investor anxiety. History suggests that the anxiety, at the index level, is largely unwarranted. Long-term equity returns are driven by earnings growth, interest rates, and economic fundamentals — not by which party controls the House or Senate. The midterm pattern of muted pre-election returns followed by strong post-election rebounds has held across dramatically different political environments for more than 90 years.
What history does not fully account for is the macro context in which any specific election occurs. If November 2026 arrives with persistent inflation, a hawkish Fed, and an energy shock still running, the standard post-election recovery playbook may underperform historical averages in ways that are not visible in the aggregate data.
For most investors, the practical implication is clear: do not restructure portfolios around election narratives, do not exit diversified equity exposure based on political predictions, and focus analytical energy on the macro and fundamental variables — rates, earnings, energy prices — that will actually determine where markets are in 2027. The election is the noise. Everything else is the signal.
Sources: US Bank Asset Management, Capital Group, BlackRock, Northern Trust, Merrill Lynch CIO, EDGE Investment Solutions, Centennial Financial Services, 1st Source Bank, Standard & Poor’s